Introduction
This document describes a Python Image Viewer that monitors data from a PVRecord. It uses the Format options from QImage.
See index For installation instructions.
After installation you are ready the run the example, which is located in directory testPython/qtimage
Run the following:
python PVAPY_Qt_Viewer.py &
python PVAPYchangePeak.py
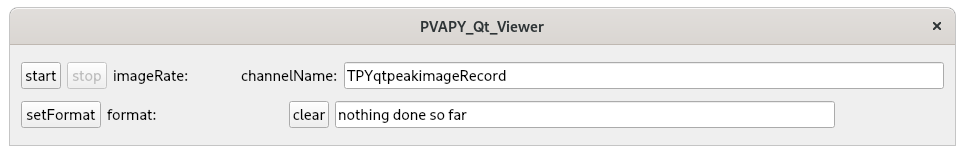
When the viewer is started the following appears:
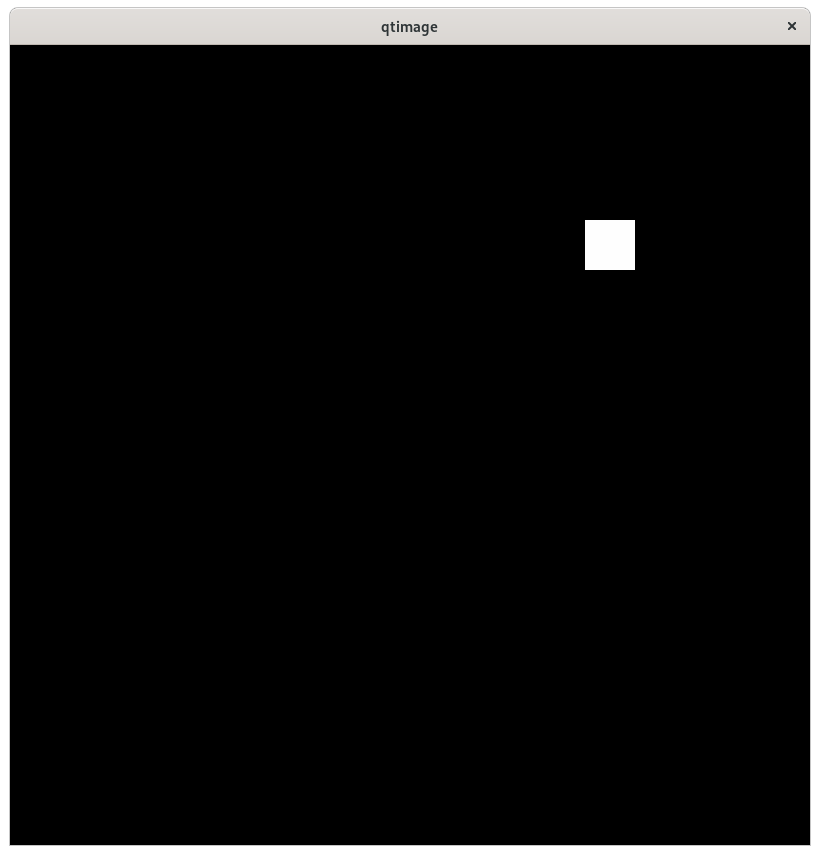
When start is clicked the following appears:
Additional features
Each time the folllowing is executed:
python PVAPYchangePeak.pyThe white square on the image moves from bottom left to upper right and changes intensity as it moves.
Next change the Format as follows:
- press stop
- press setFormat
- Select one of the formats
- press start
The image will be displayed via the selected format.
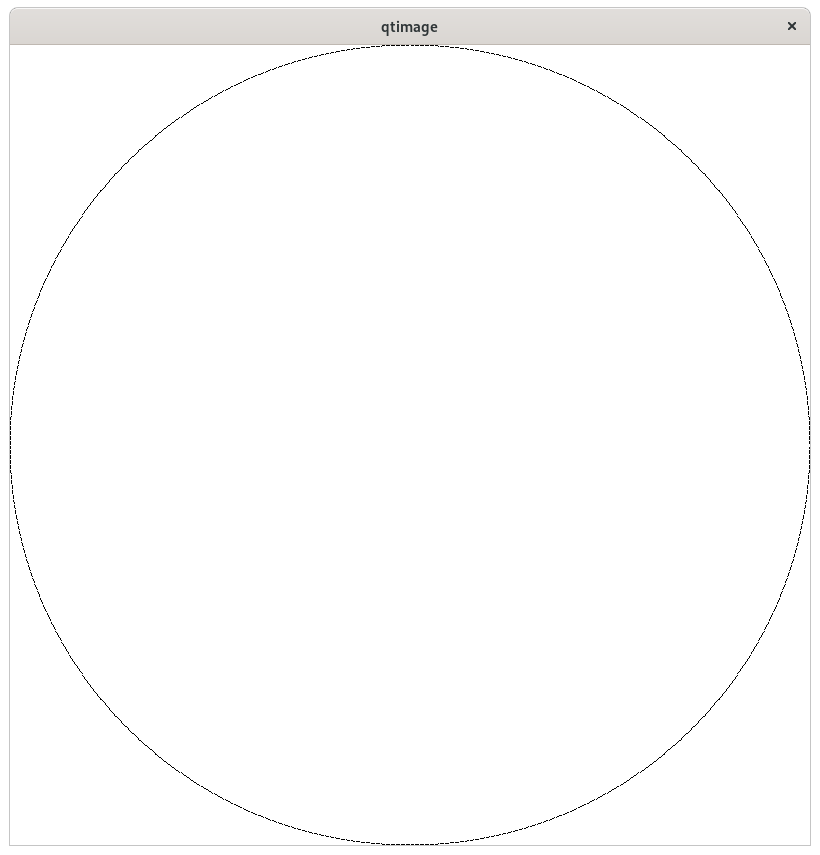
The viewer also can be used with record TPYqt2dimageRecord Do the following:
- press stop
- change the cnannelName to TPYqt2dimageRecord
- press start
- Do the following:
cd ../plot2dcurve
source exportTPYqtimageRecord
python PVAPYgenerateCurve.py circle
When start is clicked the following appears:
Python code
qtpeakimageRecord.cpp
Record TPYqtpeakimageRecord has the following fields:
    structure
        time_t timeStamp
            long secondsPastEpoch
            int nanoseconds
            int userTag
        structure peak
            double x
            double xwidth
            double y
            double ywidth
            double intensity
        structure argument
            structure format
                int index
                string[] choices
            int height
            int width
        structure result
            union value
                ubyte[] uint8
                ushort[] uint16
                uint[] uint32
The initial value of field argument is:
    structure argument
        structure format
            int index 0
            string[] choices ["Grayscale8", "Indexed8", "RGB888", "Grayscale16"]
        int height 800
        int width 800
PVAPY_Qt_Viewer.py
Qt_Viewer acceses the fields argument and result. When start is clicked it creates a monitor. Each time a monitor callback occurs numpyImage is called to display an image.
When setFormat is clicked and a choice made a put is issued to field argument.format.index This sets the format used when the record is processd.
Note that record TPYqt2dimageRecord has identical argument and result fields. But instead of peak it has the fields required by testPython/plot2dcurve/GenerateCurve Thus QtViewer can also be used for this record.
PVAPYchangePeak.py
This does multiple puts to the record changing the fields peak.x, peak.y, and peak.intensity on each put. This is what makes the peak move from lower left to upper right.